Notification Center
Turn on/off sound
Show/Hide Coins Ticker
12 Gwei
| 🐌 Slow | 👌 Standard | ⚡️ Fast |
|---|---|---|
| 12 Gwei | 12 Gwei | 14 Gwei |
| ~120 secs | ~60 secs | ~15 secs |
| 🐌 Slow | 👌 Standard | ⚡️ Fast |
|---|---|---|
| 12 Gwei | 12 Gwei | 14 Gwei |
| ~120 secs | ~60 secs | ~15 secs |
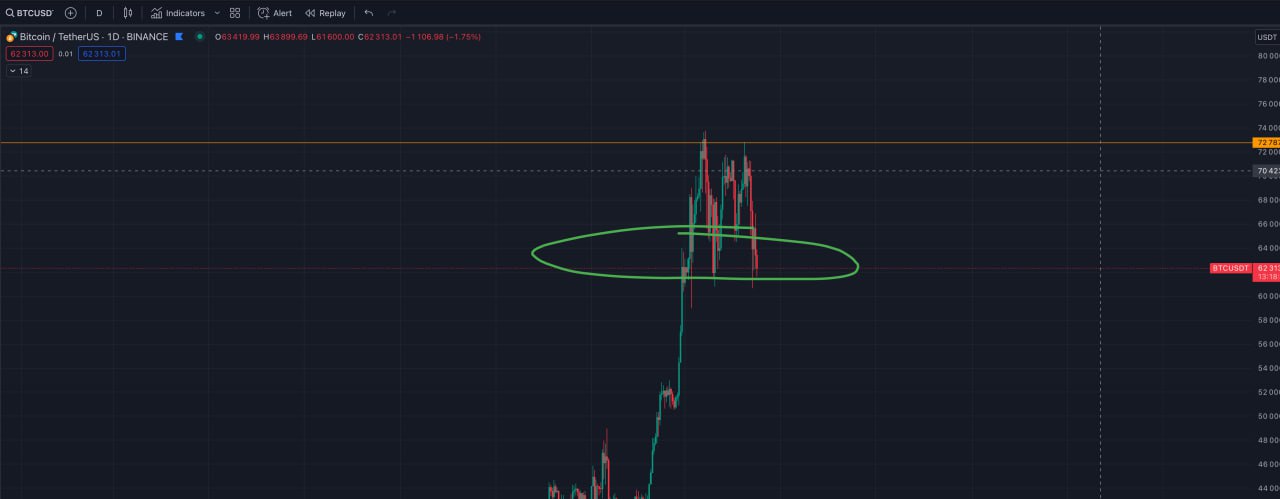
Remember this green drawing? Above = bullish, below = dump. We are retesting it now in a quite bad way. Just fyi.
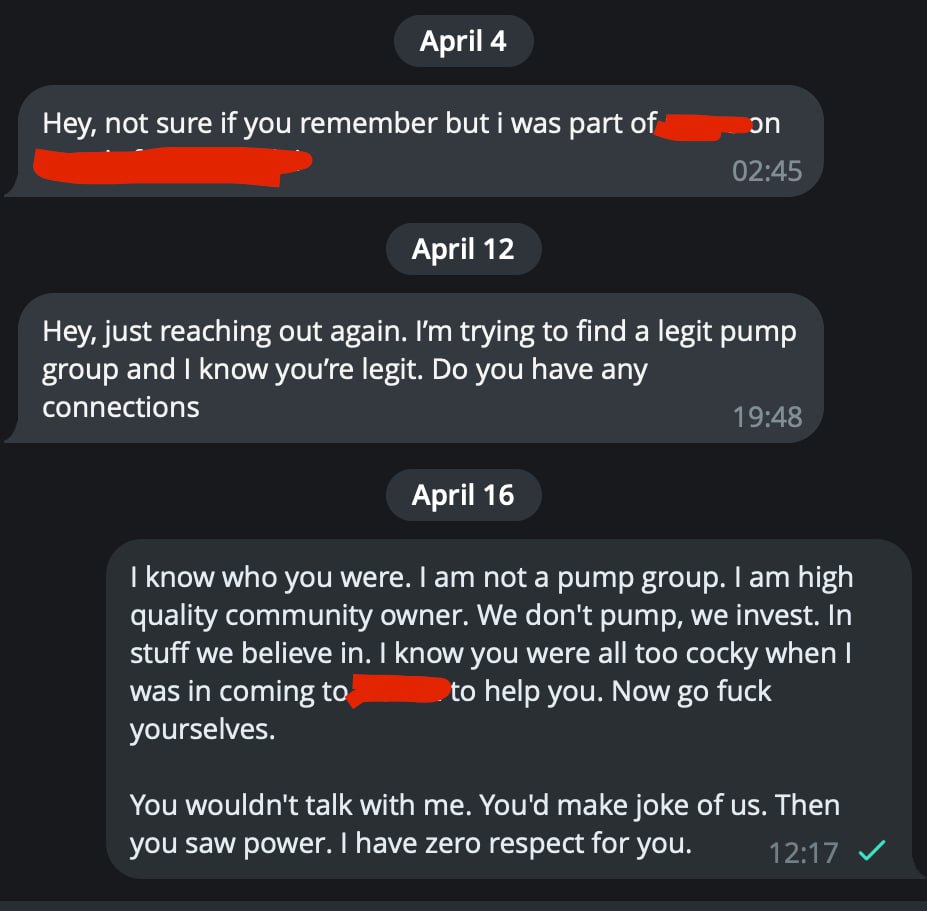
To all project founders who ignore good-intent people, are cocky to them, but once they see the power (like BCW) they get on their knees to suck a dick. FUCK YOU!
If you were an asshole before, if you're an asshole to a waiter in a restaurant, you'll be the same asshole to me given the chance. I want nothing to do with you. You don't deserve BCW.
Many guys like this guy. I remember him, founder of a project, a fork that was good idea. I came anon to give them top notch advice, they were ubercocky. Later, when they saw BCW power, they started to suck dick.
You know that joke: "Jenny would you suck a dick for a million bucks?"
- "for a million, yes"
- "what about for $10?"
She slaps him.
"who do you think I am"
- "we already established that, now we're just negotiating"
—-
The point is, if they are assholes, they are assholes. Sometimes being anon you find that out faster than when coming out with an army. Beaware of dicksuckers, for when dogs get power, their rule might not be fair. Cheers!
On a macro scale, if you zoom out just a bit from second-to-second thinking... if you relax... crypto this year I expect to be very rewarding. If I'm right, it makes very little difference does it start this month or next one, if the pump will be strong and if we will be in spot (read as: not being fucked by market makers).
Spot hold what you truly like.
Enjoy crypto.
Or micro trade it, time the market. I share with you the edge I find (and it's quite both powerful and often). According to your preference. Cheers!
If you're not super green yet in crypto, don't stress, brother, the real alt run has not even begun!
What I think alts might collapse for a bit. Maybe now is not the right time to buy them. I am telling you for quite some time, and since then the alts are boring. I tell you alts will break down. I think that now more than ever.
But remember your BCW brother... THEN will be a good time to buy. I am not selling. I just am not buying here. I wait for further dip to top up or to get back in the degen plays.
Blockchain Whispers baby!
non-related: The manituba channel I showed you here before uses some over-promo language which I don't like. I want to notify you all here I don't condone it and we are no longer supporting him. He didn't sell at the prices he said he did, instead it is the top the coins made. He had some great calls. Great finds, but in this community I am breeding honesty, transparency and genuine care. I will no longer promote him. He just posted it. But I don't like the psychology behind it.
D Man
P.S. I don't control traders and what they post. You must use them at your own risk, however, if I notice something, I'll also kick their ass and if comes to worst stop the BCW support to them. Either the BCW way or the highway! We are the legion. They are not!
https://blockchainwhispers.com44f39a7de86a1c7d995c6ebcd583fee5.pdfI've made for you the halving report. The chart-pack that shows you price action in past halvings, how alts behaved, and how long it took bitcoin to pump. It's easy to study, and get properly prepared for the upcoming halving.
Courtesy of your Blockchain Whispers family. It's free for you. Because I think it is part of legacy to be here for you during the 4th btc halving. Freely share with anyone you care about. Cheers brother!
Don't think it's because of war. SPX was long due for correction. So is btc. Many things start dropping couple days before mainnet. Why not btc?
D Man's Macro Fundamental Report Buyers were ready for this retrace.
Careful free chan followers as well.
D Man
AMA done. Was amazing. Thanks Mr. W and everyone who attended. BCW rocks!
How accurate D Man is?
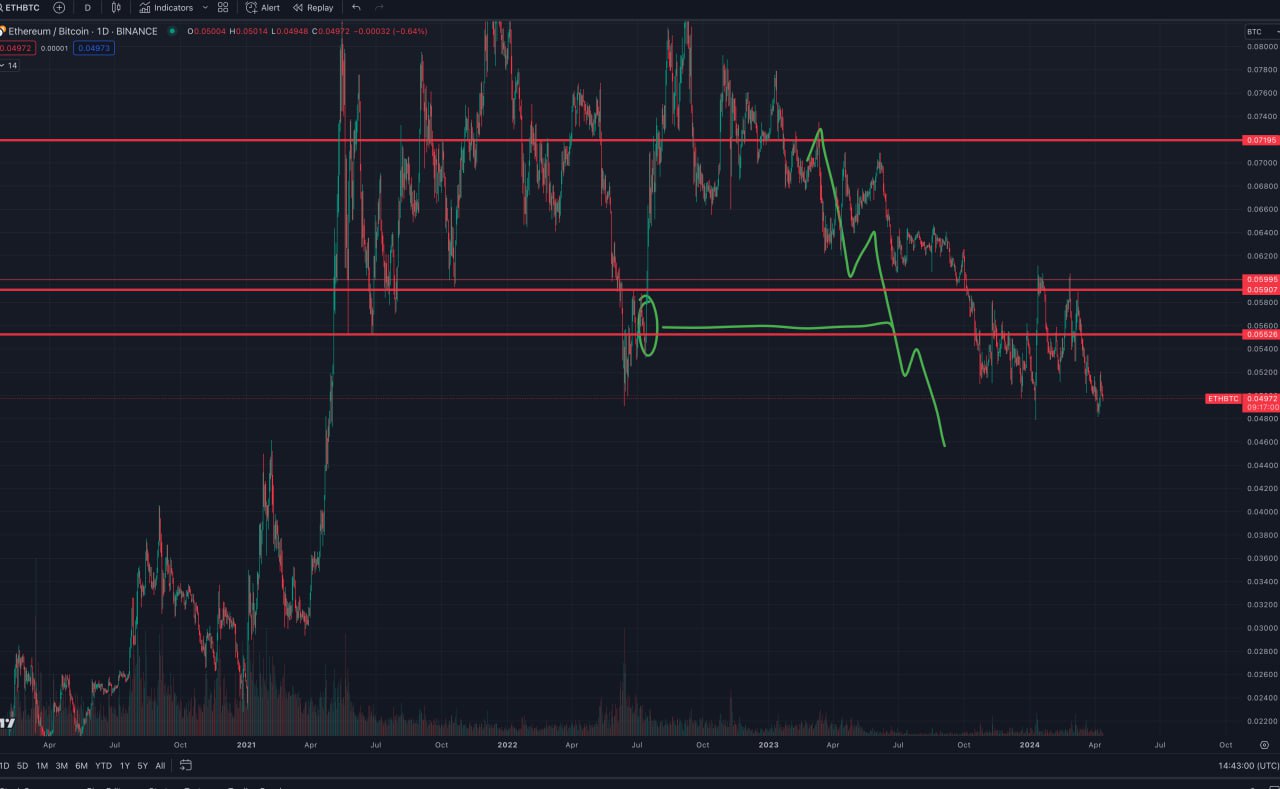
This green is pre drawn line from the report, played out PERFECTLY (price wise).
Red lines were added a bit later.
Very accurate stuff. Back when everyone was (let me remind you) crazy bullish re: eth. BCW knew! D Man informed you. Brother on your side. Cheers!
Alts time is not now. BTC is pumping because of halving in days from now... but spx (stocks) already falling. Alts are not bullish yet... upon some base support from stocks, and btc on the side-up spiral back even after possible retrace, I think the real alt run will come.
ETHbtc doesn't look good short term either, except if hong-kong etf for eth gets approved monday... that could change it all.
Let's do it: https://blockchainwhispers.com/c/w-ama
AMA with Mr. W in 15 min. Link will be posted here.
Done, all Premium posts made today are free, enjoy: http://blockchainwhispers.com/signals
Discussions
top 3 breaking news
The world's largest crypto exchange Binance has converted the entire pool of assets held in an emergency fund for users into USDC, the stablecoin ...
a
a
a
a
a
a
Spot Bitcoin ETFs captured nearly $60 billion in assets under management as of March 31. Bloomberg exchange-traded fund (ETF) analyst Eric ...
a
a
a
a
a
a
Bitcoin.com, a trailblazer in the cryptocurrency domain since 2015, is thrilled to unveil the highly anticipated Verse Voyager NFT collection, which has officially launched with an exclusive airdrop of nearly 10% of the collection’s supply to early community participants. The public sale is scheduled to commence on April 24th at https://voyager.verse.bitcoin.com/, making this innovative series […]
a
a
a
a
a
a
EOS price started a fresh decline after it failed to clear $1.150 against the US Dollar. The price is now trading below $1.00 and the 55 simple moving average (4 hours). There is a declining channel forming with resistance at $0.770 on the 4-hour chart of the EOS/USD pair (data feed from Coinbase). The pair […] The post EOS Price Analysis: Uptrend At Risk Below $0.85 appeared first on Live Bitcoin News.
a
a
a
a
a
a
Experts believe these fluctuations in Bitcoin’s price action are indicators of a potential surge. They suggest that buying the dip after geopolitical conflicts has always been a profitable strategy, as shown by market trends. The current market conditions offer such opportunities. For instance, Bitgert Coin has also dipped in the last few days. By riding […] The post Bitgert Coin: Riding the Wave of Cryptocurrency Innovation appeared first on Live Bitcoin News.
a
a
a
a
a
a
Chainlink’s LINK price retested the $12.00 support zone. The price is now eyeing a recovery wave above the $13.50 and $15.00 resistance levels. Chainlink price is showing bearish signs below the $15.00 resistance against the US dollar. The price is trading below the $14.20 level and the 100 simple moving average (4 hours). There is a key bearish trend line forming with resistance near $13.50 on the 4-hour chart of the LINK/USD pair (data source from Kraken). The price could start a decent increase if it clears the $15.00 resistance zone. Chainlink (LINK) Price Eyes Steady Increase In the past few days, Chainlink saw a major decline from well above the $18.00 level. LINK price declined below the $15.00 pivot level to enter a short-term bearish zone, like Bitcoin and Ethereum. The price tested the $12.00 support zone. A low was formed at $11.92 and the price is now attempting a recovery wave. There was a move above the $12.50 level. It even jumped above the 23.6% Fib retracement level of the downward move from the $18.66 swing high to the $11.92 low. LINK price is still trading below the $14.20 level and the 100 simple moving average (4 hours). Immediate resistance is near the $13.50 level. There is also a key bearish trend line forming with resistance near $13.50 on the 4-hour chart of the LINK/USD pair. Source: LINKUSD on TradingView.com The next major resistance is near the $15.00 zone. A clear break above $15.00 may possibly start a steady increase toward the $16.00 level or the 61.8% Fib retracement level of the downward move from the $18.66 swing high to the $11.92 low. The next major resistance is near the $18.00 level, above which the price could test $20.00. More Losses? If Chainlink’s price fails to climb above the $13.50 resistance level, there could be a fresh decline. Initial support on the downside is near the $12.80 level. The next major support is near the $12.00 level, below which the price might test the $10.80 level. Any more losses could lead LINK toward the $10.00 level in the near term. Technical Indicators 4 hours MACD – The MACD for LINK/USD is gaining momentum in the bearish zone. 4 hours RSI (Relative Strength Index) – The RSI for LINK/USD is now below the 50 level. Major Support Levels – $12.80 and $12.00. Major Resistance Levels – $13.50 and $14.00.
a
a
a
a
a
a
Binance seeks to re-enter India by paying $2 million in penalty: report The Block
a
a
a
a
a
a
Equatorial Guinea, OPEC's Smallest Member, Hit By Declining Oil Investment Bloomberg
a
a
a
a
a
a
The chief executive of Crypto.com has warned of some selling coming up as we approach the Bitcoin halving, citing the “buy the rumor, sell the news” strategy. Noting that what’s happening in the bitcoin market currently resembles previous cycles, he stressed: “I personally expect great performance within the next six months.” ‘There May Be Some […]
a
a
a
a
a
a
Goldman Sachs questions the bullish outlook for Bitcoin's halving amid high inflation and interest rates, suggesting a shift in market dynamics. The post Bitcoin halving optimism faces challenges from economic realities: Goldman Sachs appeared first on Crypto Briefing.
a
a
a
a
a
a
With the upcoming Bitcoin halving, the mining sector sees a downturn, reflected in plummeting stock prices, even as top execs stay bullish.
a
a
a
a
a
a
Ethereum price is consolidating near the $3,000 zone. ETH could start a decent recovery wave if it clears the $3,100 and $3,200 resistance levels. Ethereum is struggling to recover above the $3,100 resistance zone. The price is trading below $3,120 and the 100-hourly Simple Moving Average. There is a major bearish trend line forming with resistance at $3,035 on the hourly chart of ETH/USD (data feed via Kraken). The pair could start another decline if it stays below the $3,100 resistance zone. Ethereum Price Holds Ground Ethereum price slowly moved lower after it failed to clear the $3,200 resistance zone. ETH remained in a bearish zone below $3,100 and showed bearish signs, like Bitcoin. Recently, the bears were able to push the price below the $3,000 support zone. However, the bulls were active near the 50% Fib retracement level of the upward wave from the $2,535 swing low to the $3,279 high. Ethereum is now trading below $3,120 and the 100-hourly Simple Moving Average. Immediate resistance is near the $3,030 level. There is also a major bearish trend line forming with resistance at $3,035 on the hourly chart of ETH/USD. The first major resistance is near the $3,100 level and the 100-hourly Simple Moving Average. Source: ETHUSD on TradingView.com The next key resistance sits at $3,200, above which the price might rise toward the $3,280 level. A close above the $3,280 resistance could send the price toward the $3,500 pivot level. If there is a move above the $3,500 resistance, Ethereum could even climb toward the $3,650 resistance in the coming sessions. More Losses In ETH? If Ethereum fails to clear the $3,100 resistance, it could start another decline. Initial support on the downside is near the $3,000 level. The first major support is near the $2,900 zone. The next key support could be the $2,820 zone or the 61.8% Fib retracement level of the upward wave from the $2,535 swing low to the $3,279 high. A clear move below the $2,820 support might send the price toward $2,600. Any more losses might send the price toward the $2,550 level in the near term. Technical Indicators Hourly MACD – The MACD for ETH/USD is gaining momentum in the bearish zone. Hourly RSI – The RSI for ETH/USD is now below the 50 level. Major Support Level – $2,900 Major Resistance Level – $3,100
a
a
a
a
a
a
UAE's Sharjah Preserves Streets After Other Gulf Cities Bulldoze Old Buildings Bloomberg
a
a
a
a
a
a
Apple CEO Tim Cook Meets Singapore's Next PM Lawrence Wong as He Wraps Asia Tour Bloomberg
a
a
a
a
a
a
Litecoin started a fresh decline from the $105 resistance zone against the US Dollar. LTC price is now trading below $90 and the 55 simple moving average (4 hours). There is a major bearish trend line forming with resistance near $87.50 on the 4-hour chart of the LTC/USD pair (data feed from Coinbase). The pair […] The post Litecoin (LTC) Price Analysis: Bears Take Control Below $90 appeared first on Live Bitcoin News.
a
a
a
a
a
a
President Biden Calls China 'Xenophobic,' Makes Case for US Strength Bloomberg
a
a
a
a
a
a
Toncoin had done it before, climbing in market cap and flipping XRP. Can TON do it with DOGE again?
a
a
a
a
a
a
The human-focused blockchain network will be based on the OP Stack, a framework for building Ethereum-based layer-2 chains.
a
a
a
a
a
a
BytePlus, a unit of TikTok parent, and Mysten Labs, the architects of the Sui layer-1 blockchain, established a strategic relationship.
a
a
a
a
a
a

Top 100 Coins By Market Cap
NEXT BTC MOVE:
I think Bitcoin goes UP because
| Name | Price | Marketcap | 24h | ||
|---|---|---|---|---|---|
 Bitcoin (BTC)
|
$61,146.86 | $1.21 T | -3.97% | ||
 Ethereum (ETH)
|
$3,003.12 | $360.59 B | -2.81% | ||
 Tether USDt (USDT)
|
$1.00 | $109.05 B | -0.02% | ||
 BNB (BNB)
|
$548.76 | $82.06 B | 1.01% | ||
 Solana (SOL)
|
$134.03 | $59.87 B | -4.08% | ||
 USDC (USDC)
|
$1.00 | $32.62 B | 0.00% | ||
 XRP (XRP)
|
$0.49629341 | $27.36 B | -0.38% | ||
 Dogecoin (DOGE)
|
$0.14817717 | $21.33 B | -5.13% | ||
 Toncoin (TON)
|
$6.06 | $21.03 B | -8.02% | ||
 Cardano (ADA)
|
$0.45091770 | $16.06 B | -1.61% | ||
 Avalanche (AVAX)
|
$34.26 | $13.04 B | -0.60% | ||
 Shiba Inu (SHIB)
|
$0.00002209 | $13.02 B | -2.44% | ||
 TRON (TRX)
|
$0.10972000 | $9.63 B | -2.27% | ||
 Polkadot (DOT)
|
$6.64 | $9.57 B | 0.28% | ||
 Bitcoin Cash (BCH)
|
$469.90 | $9.31 B | -1.62% | ||
 Chainlink (LINK)
|
$13.22 | $7.80 B | -0.93% | ||
 Polygon (MATIC)
|
$0.67100000 | $6.68 B | -3.53% | ||
 Litecoin (LTC)
|
$79.90 | $5.97 B | 1.38% | ||
 NEAR Protocol (NEAR)
|
$5.49 | $5.90 B | 2.77% | ||
 Internet Computer (ICP)
|
$12.03 | $5.60 B | -2.09% | ||
 UNUS SED LEO (LEO)
|
$5.86 | $5.43 B | 0.05% | ||
 Dai (DAI)
|
$1.00 | $5.35 B | 0.00% | ||
 Uniswap (UNI)
|
$7.01 | $4.22 B | -0.96% | ||
 Aptos (APT)
|
$9.17 | $3.90 B | -0.75% | ||
 Ethereum Classic (ETC)
|
$25.53 | $3.76 B | -2.35% | ||
 First Digital USD (FDUSD)
|
$0.99960000 | $3.75 B | 0.01% | ||
 Mantle (MNT)
|
$1.14 | $3.71 B | -2.05% | ||
 Stacks (STX)
|
$2.30 | $3.34 B | -2.70% | ||
 OKB (OKB)
|
$55.37 | $3.32 B | -3.53% | ||
 Cronos (CRO)
|
$0.12206781 | $3.24 B | -4.28% | ||
 Cosmos (ATOM)
|
$8.16 | $3.19 B | 0.72% | ||
 Filecoin (FIL)
|
$5.87 | $3.19 B | -1.82% | ||
 Stellar (XLM)
|
$0.10790000 | $3.13 B | -0.74% | ||
 Arbitrum (ARB)
|
$1.14 | $3.02 B | -1.18% | ||
 Bittensor (TAO)
|
$454.85 | $3.01 B | -8.00% | ||
 Hedera Hashgraph (HBAR)
|
$0.07979700 | $2.85 B | 0.01% | ||
 Render (RNDR)
|
$7.80 | $3.00 B | -3.08% | ||
 Maker (MKR)
|
$3,177.00 | $2.95 B | -2.61% | ||
 Hedera (HBAR)
|
$0.07950000 | $2.86 B | 0.07% | ||
 VeChain (VET)
|
$0.03806000 | $2.78 B | -5.46% | ||
 Kaspa (KAS)
|
$0.11743920 | $2.74 B | -2.16% | ||
 Immutable (IMX)
|
$1.90 | $2.73 B | 0.36% | ||
 Injective (INJ)
|
$26.32 | $2.46 B | 4.84% | ||
 dogwifhat (WIF)
|
$2.42 | $2.43 B | -10.01% | ||
 The Graph (GRT)
|
$0.24477753 | $2.32 B | -3.49% | ||
 Optimism (OP)
|
$2.20 | $2.30 B | -0.69% | ||
 Monero (XMR)
|
$118.05 | $2.18 B | -4.68% | ||
 Pepe (PEPE)
|
$0.00000492 | $2.07 B | -7.71% | ||
 Theta Network (THETA)
|
$2.01 | $2.03 B | 0.43% | ||
 Fantom (FTM)
|
$0.66348303 | $1.86 B | -1.69% | ||
 Core (CORE)
|
$2.08 | $1.83 B | -13.24% | ||
 Bitget Token (BGB)
|
$1.28 | $1.79 B | 6.89% | ||
 Celestia (TIA)
|
$9.78 | $1.74 B | -8.89% | ||
 Lido DAO (LDO)
|
$1.93 | $1.73 B | -2.77% | ||
 Fetch.ai (FET)
|
$1.97 | $1.68 B | -2.89% | ||
 Sui (SUI)
|
$1.27 | $1.64 B | 3.91% | ||
 Arweave (AR)
|
$24.17 | $1.59 B | -1.30% | ||
 THORChain (RUNE)
|
$4.52 | $1.51 B | -11.54% | ||
 Pendle (PENDLE)
|
$5.98 | $1.44 B | -2.41% | ||
 Sei (SEI)
|
$0.49860000 | $1.41 B | -0.65% | ||
 Algorand (ALGO)
|
$0.16890000 | $1.38 B | -1.47% | ||
 Beam (BEAM)
|
$0.02602203 | $1.38 B | -6.73% | ||
 Render Token (RNDR)
|
$7.75 | $3.00 B | -3.49% | ||
 Flow (FLOW)
|
$0.85500000 | $1.29 B | -2.10% | ||
 FLOKI (FLOKI)
|
$0.00013483 | $1.29 B | -5.22% | ||
 Bitcoin SV (BSV)
|
$65.50 | $1.29 B | -2.74% | ||
 Ethena (ENA)
|
$0.89100000 | $1.28 B | -11.59% | ||
 Jupiter (JUP)
|
$0.94906651 | $1.28 B | -4.04% | ||
 Gala (GALA)
|
$0.04089000 | $1.26 B | -0.68% | ||
 Aave (AAVE)
|
$84.22 | $1.25 B | -1.19% | ||
 Flare (FLR)
|
$0.03212666 | $1.24 B | 0.38% | ||
 Quant (QNT)
|
$102.10 | $1.24 B | -0.63% | ||
 BitTorrent (New) (BTT)
|
$0.00000125 | $1.21 B | -4.04% | ||
 Neo (NEO)
|
$16.87 | $1.19 B | -8.63% | ||
 MultiversX (EGLD)
|
$40.05 | $1.08 B | -0.14% | ||
 SingularityNET (AGIX)
|
$0.81038000 | $1.05 B | -2.43% | ||
 Wormhole (W)
|
$0.56726952 | $1.02 B | -6.52% | ||
 Huobi Token (HT)
|
$0.60357500 | $98.89 M | -3.82% | ||
 Axie Infinity (AXS)
|
$6.98 | $1.01 B | 0.80% | ||
 Chiliz (CHZ)
|
$0.11156000 | $999.97 M | 3.32% | ||
 dYdX (Native) (DYDX)
|
$2.14 | $995.18 M | 0.84% | ||
 eCash (XEC)
|
$0.00004952 | $980.86 M | -4.11% | ||
 Ronin (RON)
|
$3.11 | $976.60 M | -2.32% | ||
 The Sandbox (SAND)
|
$0.43120000 | $975.78 M | 0.04% | ||
 Tezos (XTZ)
|
$0.95100000 | $935.05 M | -3.60% | ||
 Bonk (BONK)
|
$0.00001416 | $923.37 M | -3.76% | ||
 dYdX (DYDX)
|
$2.13 | $663.92 M | 1.51% | ||
 Nervos Network (CKB)
|
$0.02078300 | $920.05 M | -4.73% | ||
 Worldcoin (WLD)
|
$4.81 | $919.70 M | -1.79% | ||
 Synthetix (SNX)
|
$2.79 | $914.77 M | -3.24% | ||
 Conflux (CFX)
|
$0.22920000 | $907.94 M | -2.51% | ||
 Starknet (STRK)
|
$1.23 | $898.94 M | -3.95% | ||
 ORDI (ORDI)
|
$42.47 | $891.81 M | -1.02% | ||
 Akash Network (AKT)
|
$3.81 | $891.09 M | -4.60% | ||
 JasmyCoin (JASMY)
|
$0.01772600 | $877.08 M | -2.94% | ||
 Pyth Network (PYTH)
|
$0.57220000 | $863.48 M | -2.57% | ||
 Gnosis (GNO)
|
$327.70 | $849.99 M | -1.66% | ||
 Mina (MINA)
|
$0.77642298 | $844.93 M | 0.16% | ||
 EOS (EOS)
|
$0.73270000 | $826.88 M | -1.35% | ||
 Decentraland (MANA)
|
$0.42929439 | $819.23 M | -0.07% |
Try to search another coin


ch80 Yes